Quora: Has Facebook’s DAU/MAU always been ~50%?
I recently asked, and then answered my own question on Quora and wanted to share here as well.
Has Facebook’s DAU/MAU always been ~50%?
According to public info, Facebook’s DAU/MAU is 58% these days. Here’s a link.
It states:
- 901 million monthly active users at the end of March 2012
- 526 million daily active users on average in March 2012
Has Facebook’s DAU/MAU always been this good, as a consequence of its product category (communication/photo-sharing/etc.)? Or was it once a lot worse and was improved over time?
(UPDATE: Here’s a followup question I have about the same topic- Was Facebook’s DAU/MAU ~50% prior to launching the Newsfeed in 2009?)
Answer: Yes, Facebook’s DAU/MAU has been close to 50%, at least since 2004.
Based on their media kit from 2004, their DAU/MAU was already 75%.
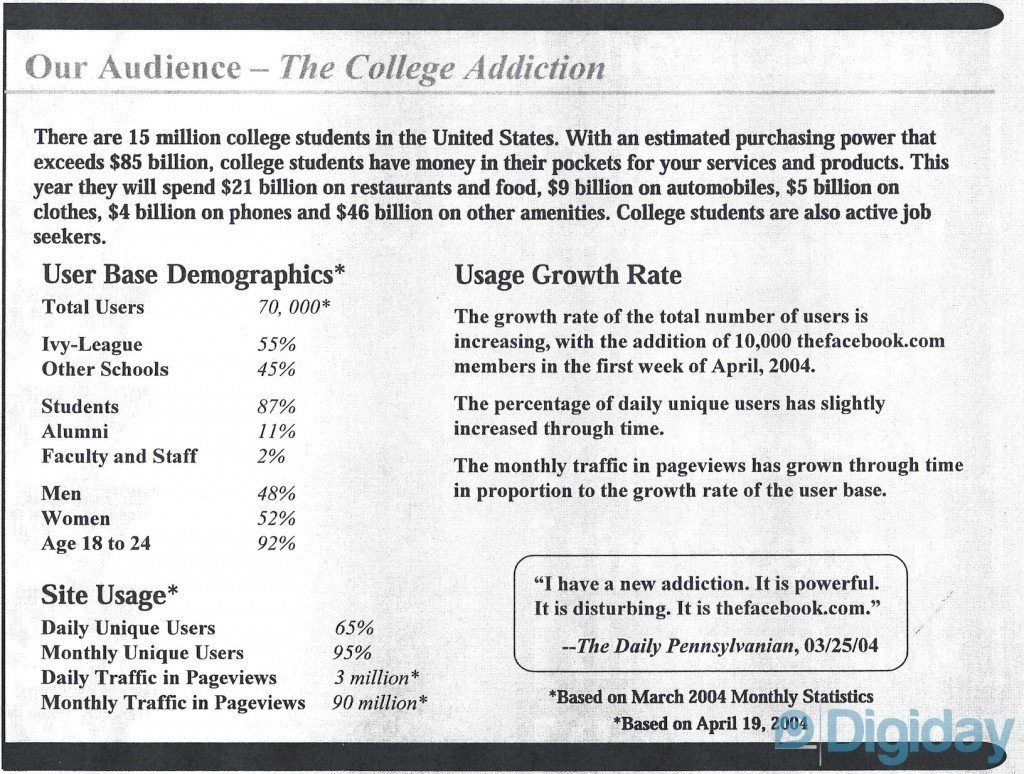
Since this media kit, their DAU/MAU data has been included in their financials since 2009. However, I theorize that Facebook’s DAU/MAU has always been high as a natural outcome of the communication-oriented usage of the product. Contrast this to a product category like ecommerce which you are unlikely to use and purchase with every day.
In their recent financial filings, the following chart is shown for Facebook’s DAU and MAU since 2009:

If you do a graph of the DAU/MAU on this data, since 2009, you’ll see that it starts around 45-47% and goes up to a very impressive 58% recently.

(As an aside, another interesting aspect is that Facebook’s MAU growth looks pretty much like a straight line, and so the % growth has been slowing down as of late. The MAU growth was around 23% starting in 2009, but is now down to 6-7% in recent months. See below for a graph on MAU vs % MAU growth)

PS. Get new updates/analysis on tech and startups
I write a high-quality, weekly newsletter covering what's happening in Silicon Valley, focused on startups, marketing, and mobile.
Views expressed in “content” (including posts, podcasts, videos) linked on this website or posted in social media and other platforms (collectively, “content distribution outlets”) are my own and are not the views of AH Capital Management, L.L.C. (“a16z”) or its respective affiliates. AH Capital Management is an investment adviser registered with the Securities and Exchange Commission. Registration as an investment adviser does not imply any special skill or training. The posts are not directed to any investors or potential investors, and do not constitute an offer to sell -- or a solicitation of an offer to buy -- any securities, and may not be used or relied upon in evaluating the merits of any investment.
The content should not be construed as or relied upon in any manner as investment, legal, tax, or other advice. You should consult your own advisers as to legal, business, tax, and other related matters concerning any investment. Any projections, estimates, forecasts, targets, prospects and/or opinions expressed in these materials are subject to change without notice and may differ or be contrary to opinions expressed by others. Any charts provided here are for informational purposes only, and should not be relied upon when making any investment decision. Certain information contained in here has been obtained from third-party sources. While taken from sources believed to be reliable, I have not independently verified such information and makes no representations about the enduring accuracy of the information or its appropriateness for a given situation. The content speaks only as of the date indicated.
Under no circumstances should any posts or other information provided on this website -- or on associated content distribution outlets -- be construed as an offer soliciting the purchase or sale of any security or interest in any pooled investment vehicle sponsored, discussed, or mentioned by a16z personnel. Nor should it be construed as an offer to provide investment advisory services; an offer to invest in an a16z-managed pooled investment vehicle will be made separately and only by means of the confidential offering documents of the specific pooled investment vehicles -- which should be read in their entirety, and only to those who, among other requirements, meet certain qualifications under federal securities laws. Such investors, defined as accredited investors and qualified purchasers, are generally deemed capable of evaluating the merits and risks of prospective investments and financial matters. There can be no assurances that a16z’s investment objectives will be achieved or investment strategies will be successful. Any investment in a vehicle managed by a16z involves a high degree of risk including the risk that the entire amount invested is lost. Any investments or portfolio companies mentioned, referred to, or described are not representative of all investments in vehicles managed by a16z and there can be no assurance that the investments will be profitable or that other investments made in the future will have similar characteristics or results. A list of investments made by funds managed by a16z is available at https://a16z.com/investments/. Excluded from this list are investments for which the issuer has not provided permission for a16z to disclose publicly as well as unannounced investments in publicly traded digital assets. Past results of Andreessen Horowitz’s investments, pooled investment vehicles, or investment strategies are not necessarily indicative of future results. Please see https://a16z.com/disclosures for additional important information.