What factors influence DAU/MAU? Nature versus nurture

Surprisingly, it can be hard to figure out if you’re at Product/Market Fit or not, and one of the big reasons is that comparable numbers are difficult or impossible to come by. You have to look at comps for products in a similar or equal product category, and sometimes they just aren’t available.
Nature versus nurture
One way to think about this is that products have a nature/nurture element to their metrics. Some product categories, like chat or email, are naturally high-frequency. You use them a lot. Other products, like tax software, might give you value but you only use it once per year. A lot of ecommerce products are in-between, where you might buy gadgets every couple months but not every day. Just because people only use your product once a year doesn’t mean you don’t have product/market fit, as long as you’re building a tax product and not chat.
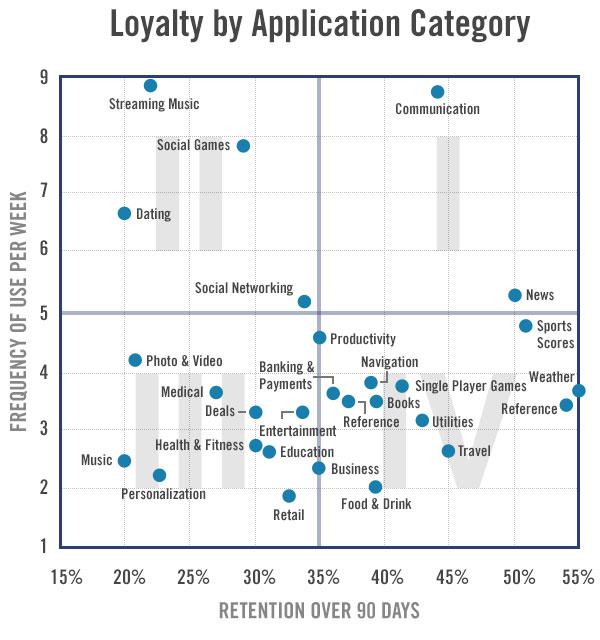
Here’s a great article on the breakdown of retention versus frequency for a bunch of categories on mobile:http://blog.flurry.com/bid/26376/Mobile-Apps-Models-Money-and-Loyalty
The two extremes are interesting:
- Medical apps: They may have high retention since if you have a chronic ailment, you may constantly be using an app relevant to your condition, but maybe not every day
- Books/Games: You read them nonstop for a few days or a week or two, and then once you’ve consumed the content, you never go back
The point I’ll make on this is that due to the nature of certain product categories, there’s a natural range of DAU/MAUs, +1 day and +1 week retention metrics. That’s the “nature” part of the product category. No matter how good your tax software is, you won’t get people to use it every day.
Based on your product execution though, you can maximize the the metrics within the natural range. A really good news product like Flipboard is able to drive 50%+ DAU/MAUs, which are fantastic.
Some product categories cannot get high DAU/MAUs
One key conclusion of this is that it doesn’t make sense to try to compare against Twitter or Facebook’s 50% DAU/MAU unless you are in the same category as them. A lot of social games target 30% DAU/MAU, but we can also see from the Flurry chart that social games are also amongst the highest DAU/MAU categories.
That said, if you are in the same category, then these rival products really tell you how good your metrics could really be, if you executed them in the right way.
Either way, don’t fight your nature :)
Update: New chart from Flurry
A while after I wrote this, Flurry released a new version of their chart, which you can see below. Full article here. It’s interesting to see which categories have shifted a bit, I imagine because the number of new apps in each category has changed a lot.
I write a high-quality, weekly newsletter covering what's happening in Silicon Valley, focused on startups, marketing, and mobile.
Views expressed in “content” (including posts, podcasts, videos) linked on this website or posted in social media and other platforms (collectively, “content distribution outlets”) are my own and are not the views of AH Capital Management, L.L.C. (“a16z”) or its respective affiliates. AH Capital Management is an investment adviser registered with the Securities and Exchange Commission. Registration as an investment adviser does not imply any special skill or training. The posts are not directed to any investors or potential investors, and do not constitute an offer to sell -- or a solicitation of an offer to buy -- any securities, and may not be used or relied upon in evaluating the merits of any investment.
The content should not be construed as or relied upon in any manner as investment, legal, tax, or other advice. You should consult your own advisers as to legal, business, tax, and other related matters concerning any investment. Any projections, estimates, forecasts, targets, prospects and/or opinions expressed in these materials are subject to change without notice and may differ or be contrary to opinions expressed by others. Any charts provided here are for informational purposes only, and should not be relied upon when making any investment decision. Certain information contained in here has been obtained from third-party sources. While taken from sources believed to be reliable, I have not independently verified such information and makes no representations about the enduring accuracy of the information or its appropriateness for a given situation. The content speaks only as of the date indicated.
Under no circumstances should any posts or other information provided on this website -- or on associated content distribution outlets -- be construed as an offer soliciting the purchase or sale of any security or interest in any pooled investment vehicle sponsored, discussed, or mentioned by a16z personnel. Nor should it be construed as an offer to provide investment advisory services; an offer to invest in an a16z-managed pooled investment vehicle will be made separately and only by means of the confidential offering documents of the specific pooled investment vehicles -- which should be read in their entirety, and only to those who, among other requirements, meet certain qualifications under federal securities laws. Such investors, defined as accredited investors and qualified purchasers, are generally deemed capable of evaluating the merits and risks of prospective investments and financial matters. There can be no assurances that a16z’s investment objectives will be achieved or investment strategies will be successful. Any investment in a vehicle managed by a16z involves a high degree of risk including the risk that the entire amount invested is lost. Any investments or portfolio companies mentioned, referred to, or described are not representative of all investments in vehicles managed by a16z and there can be no assurance that the investments will be profitable or that other investments made in the future will have similar characteristics or results. A list of investments made by funds managed by a16z is available at https://a16z.com/investments/. Excluded from this list are investments for which the issuer has not provided permission for a16z to disclose publicly as well as unannounced investments in publicly traded digital assets. Past results of Andreessen Horowitz’s investments, pooled investment vehicles, or investment strategies are not necessarily indicative of future results. Please see https://a16z.com/disclosures for additional important information.